Embedding Graph, Tables, Maps and Charts in your blog rather adding images, gives better SEO and look
Photo by Lukas Blazek on Unsplash
Are you looking for a way to insert your data into a chart for your Financial Blog? Embedding growth chart for customers or making a table for your subscribers when starting digital marketing, these can be the places where one might look for it.
You know better than me how well a job can be done if putting 5 minutes effort can give much better results.
For all this you’d need to put Charts and Tables, even can use Maps to make the post more informative and much readable.
Embed any of it just by signing into Datawrapper. Using free plan was enough for me, would be for you too.
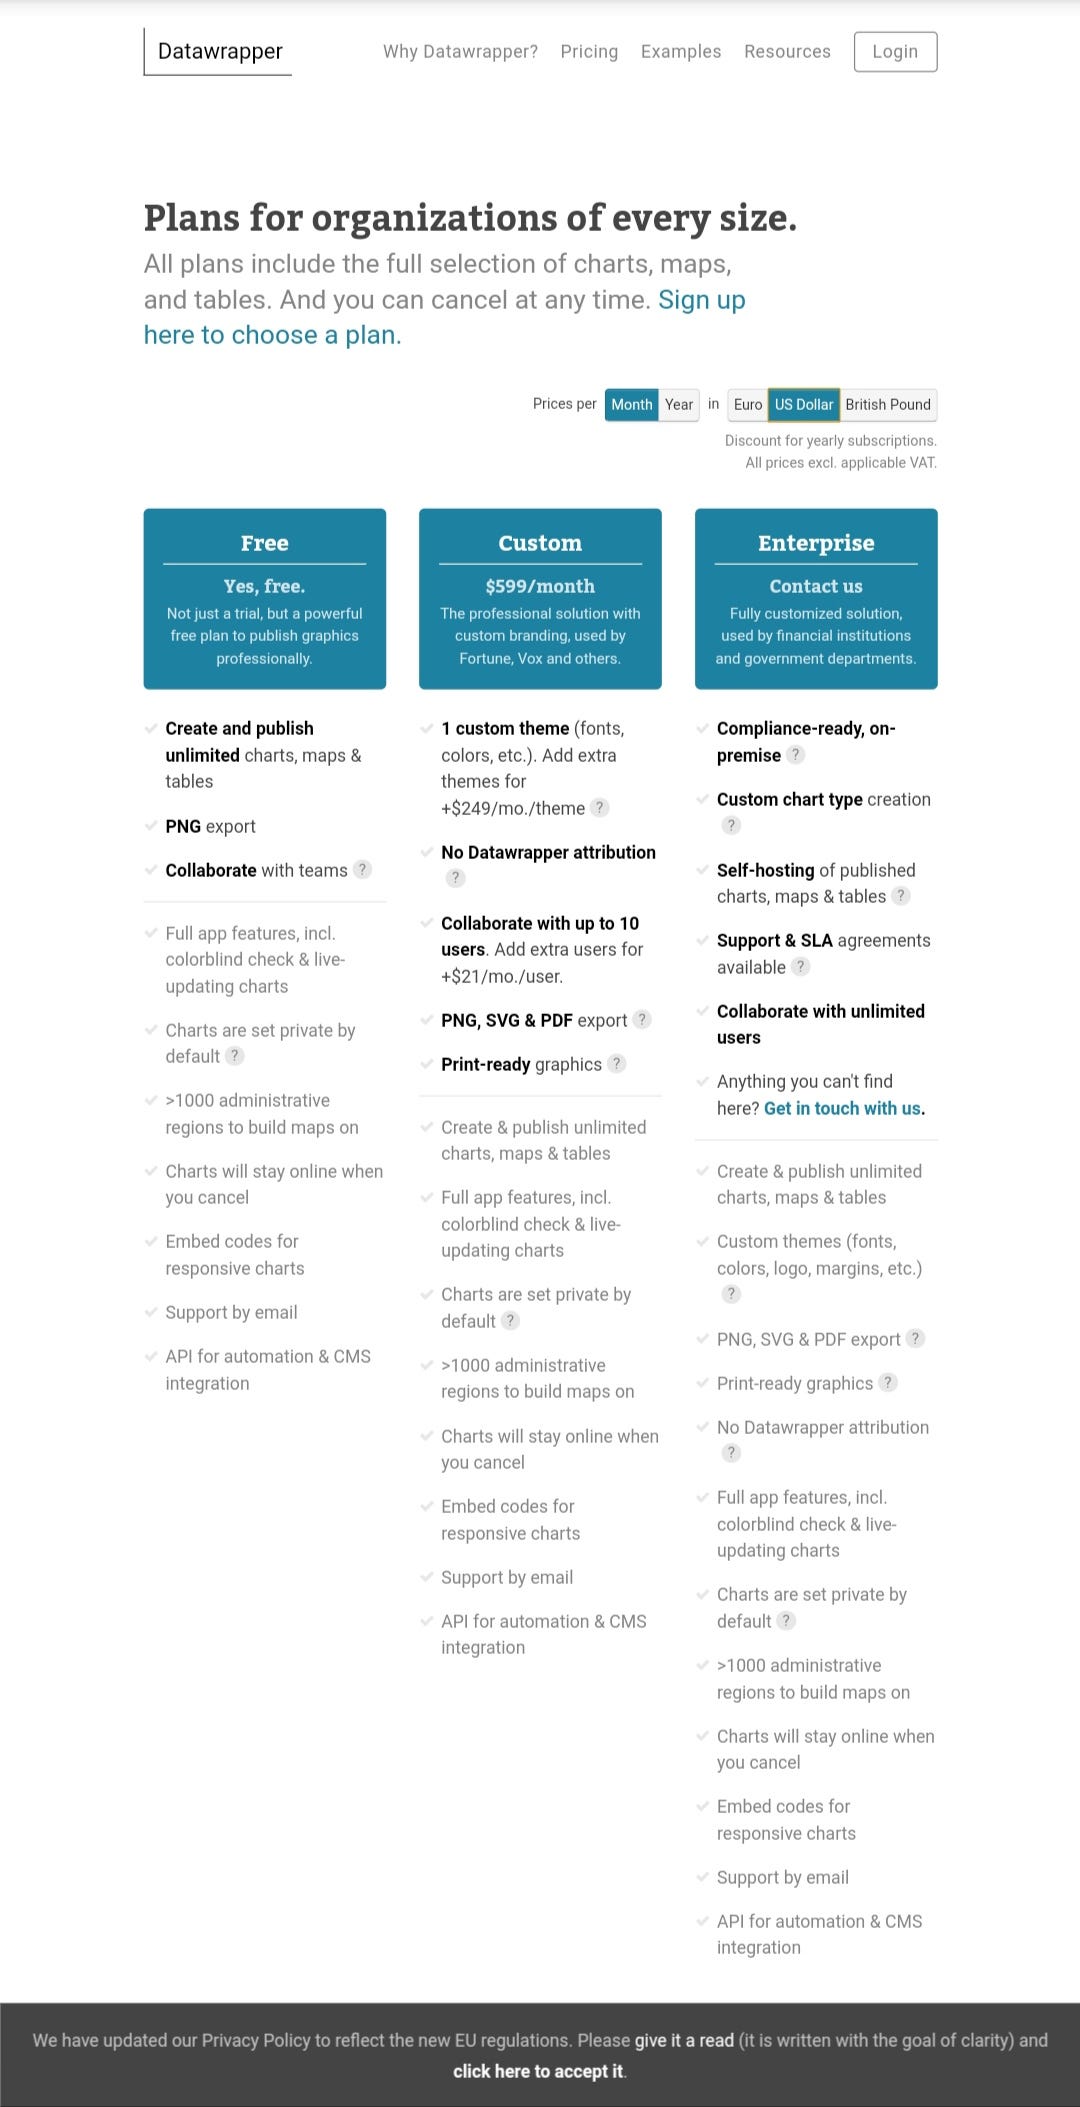
Pricing:
Pricing of Datawrapper Plan. Screenshot taken from their website.
After looking at all the options I felt like using all of these, it’s just that I don’t have anything much to blog requiring these. So, I thought of sharing to those who still don’t know about it and can make a better use of it. I found these very attractive. I m sharing few clips taken from the sites, then I’ll go straight to brief the really easy steps. You might not need to read further, just go with the images to have an idea, what’s on the way.
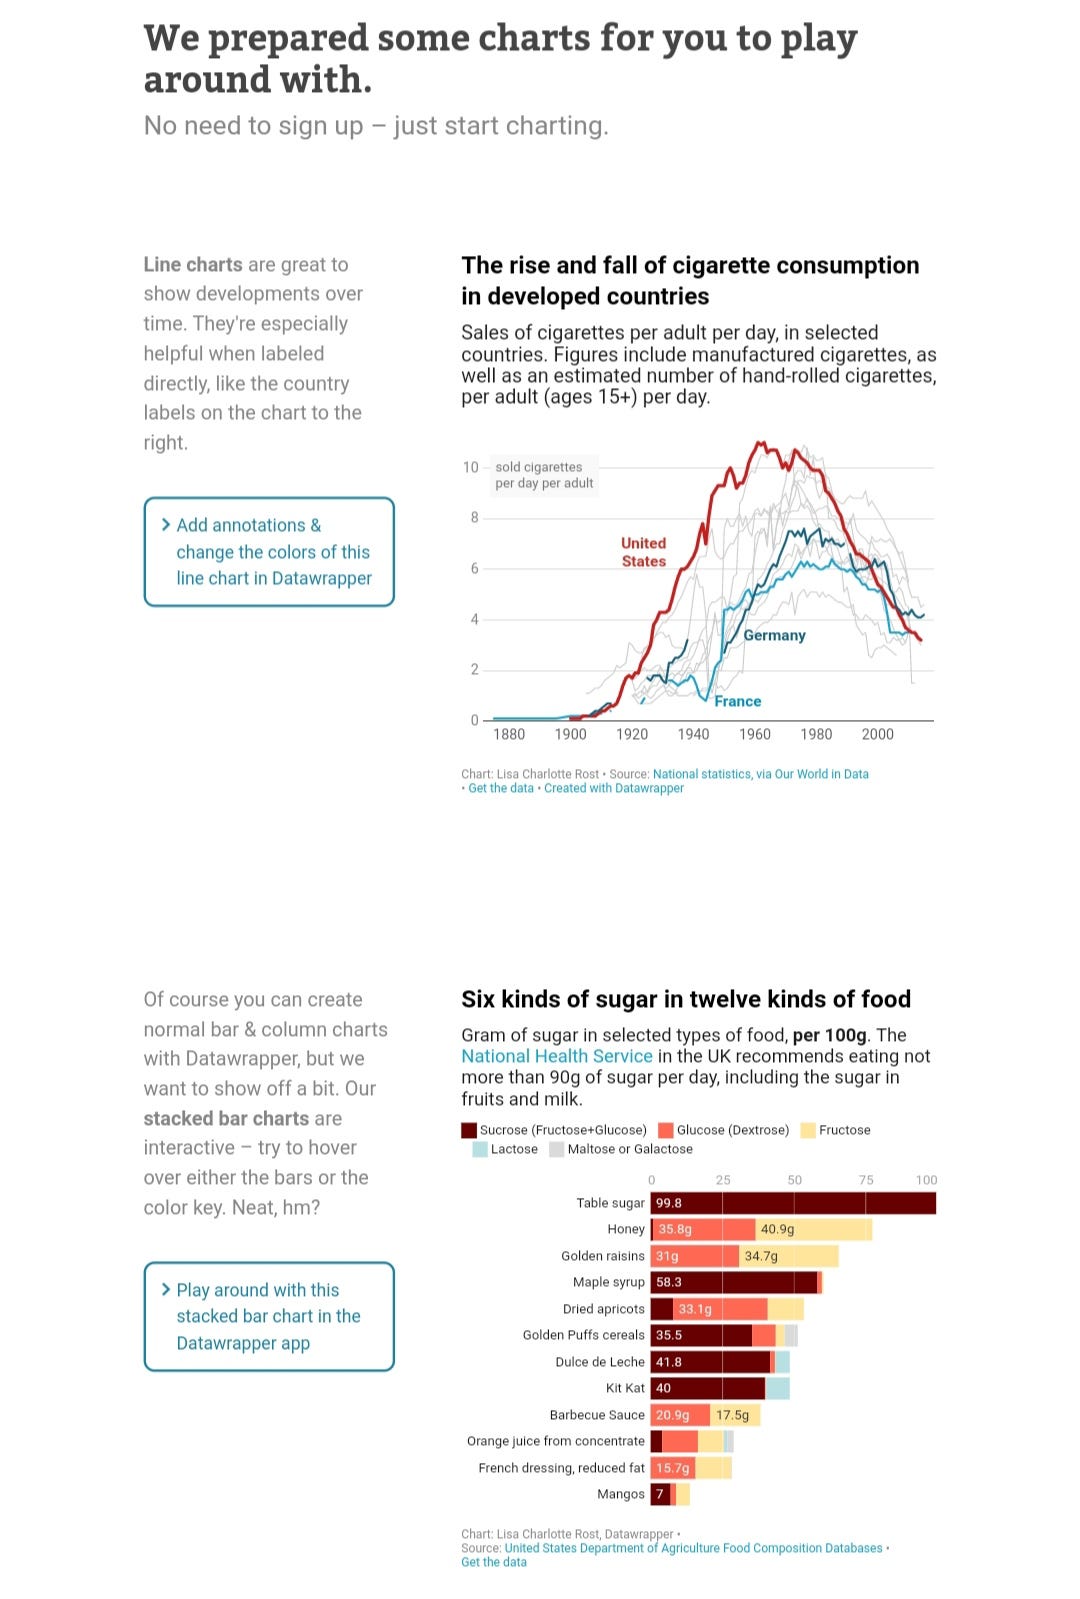
Charts: (Screenshots taken from the site)
Screenshot taken from Datawrapper site.
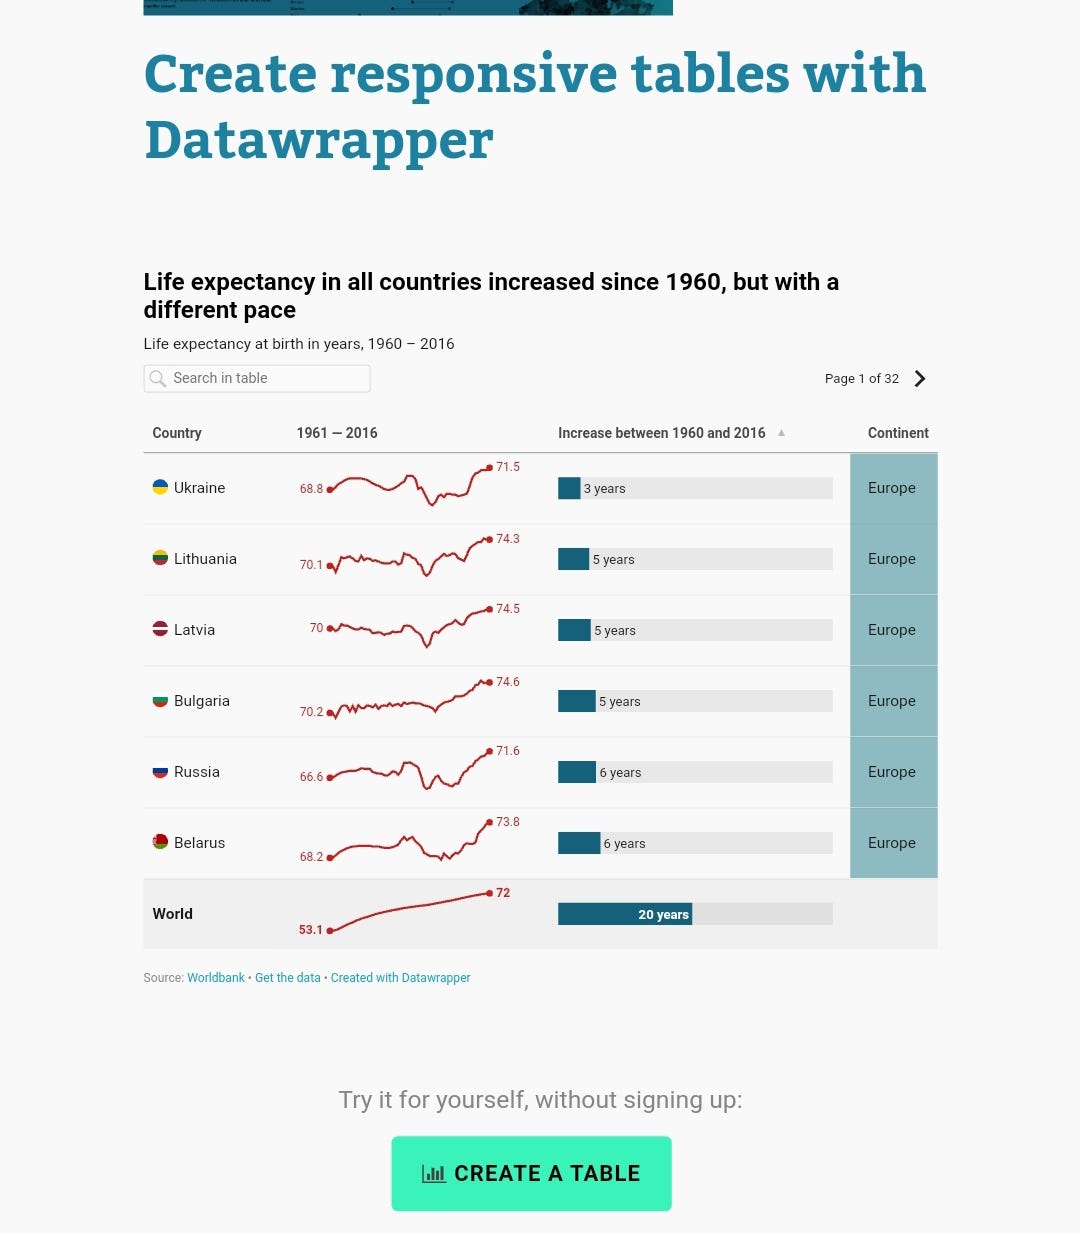
Tables:
Screenshot taken from Datawrapper site.
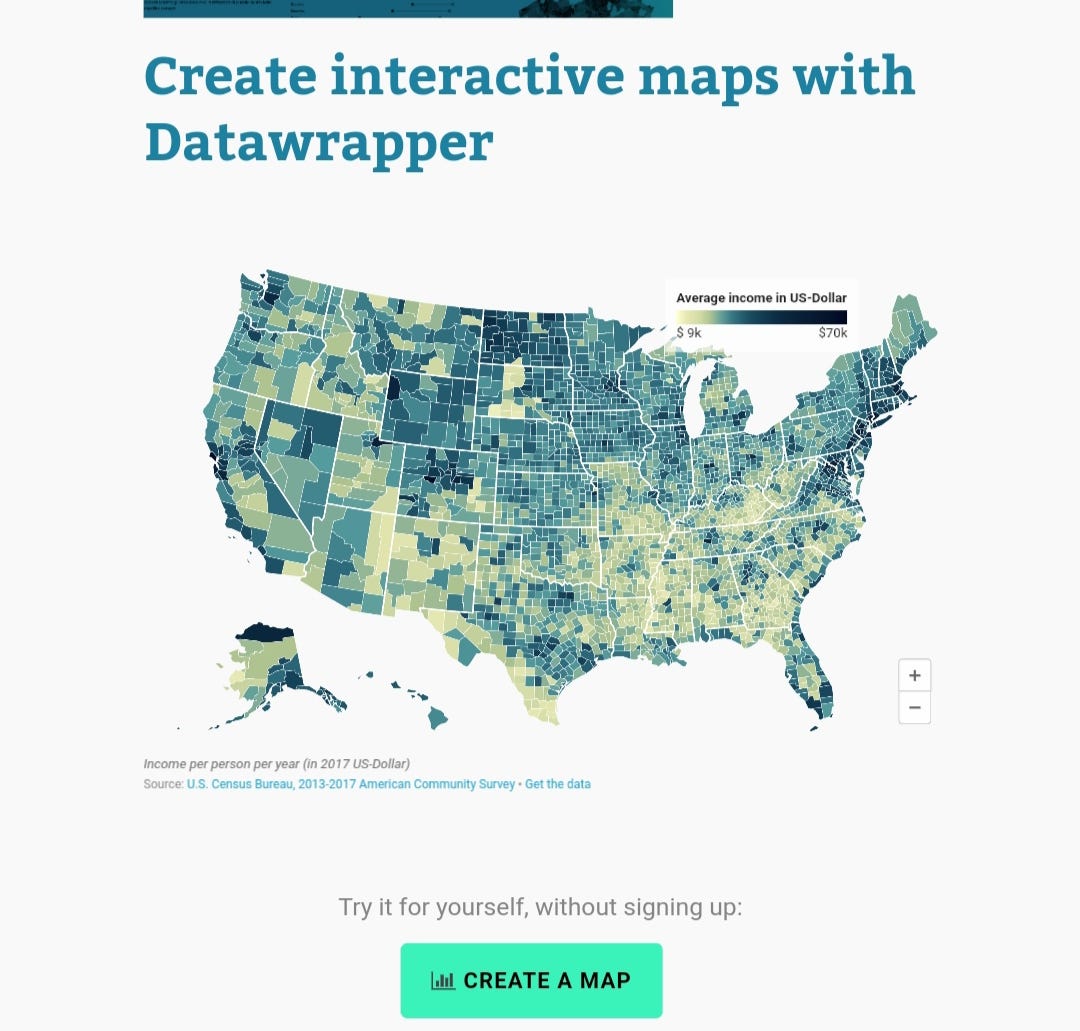
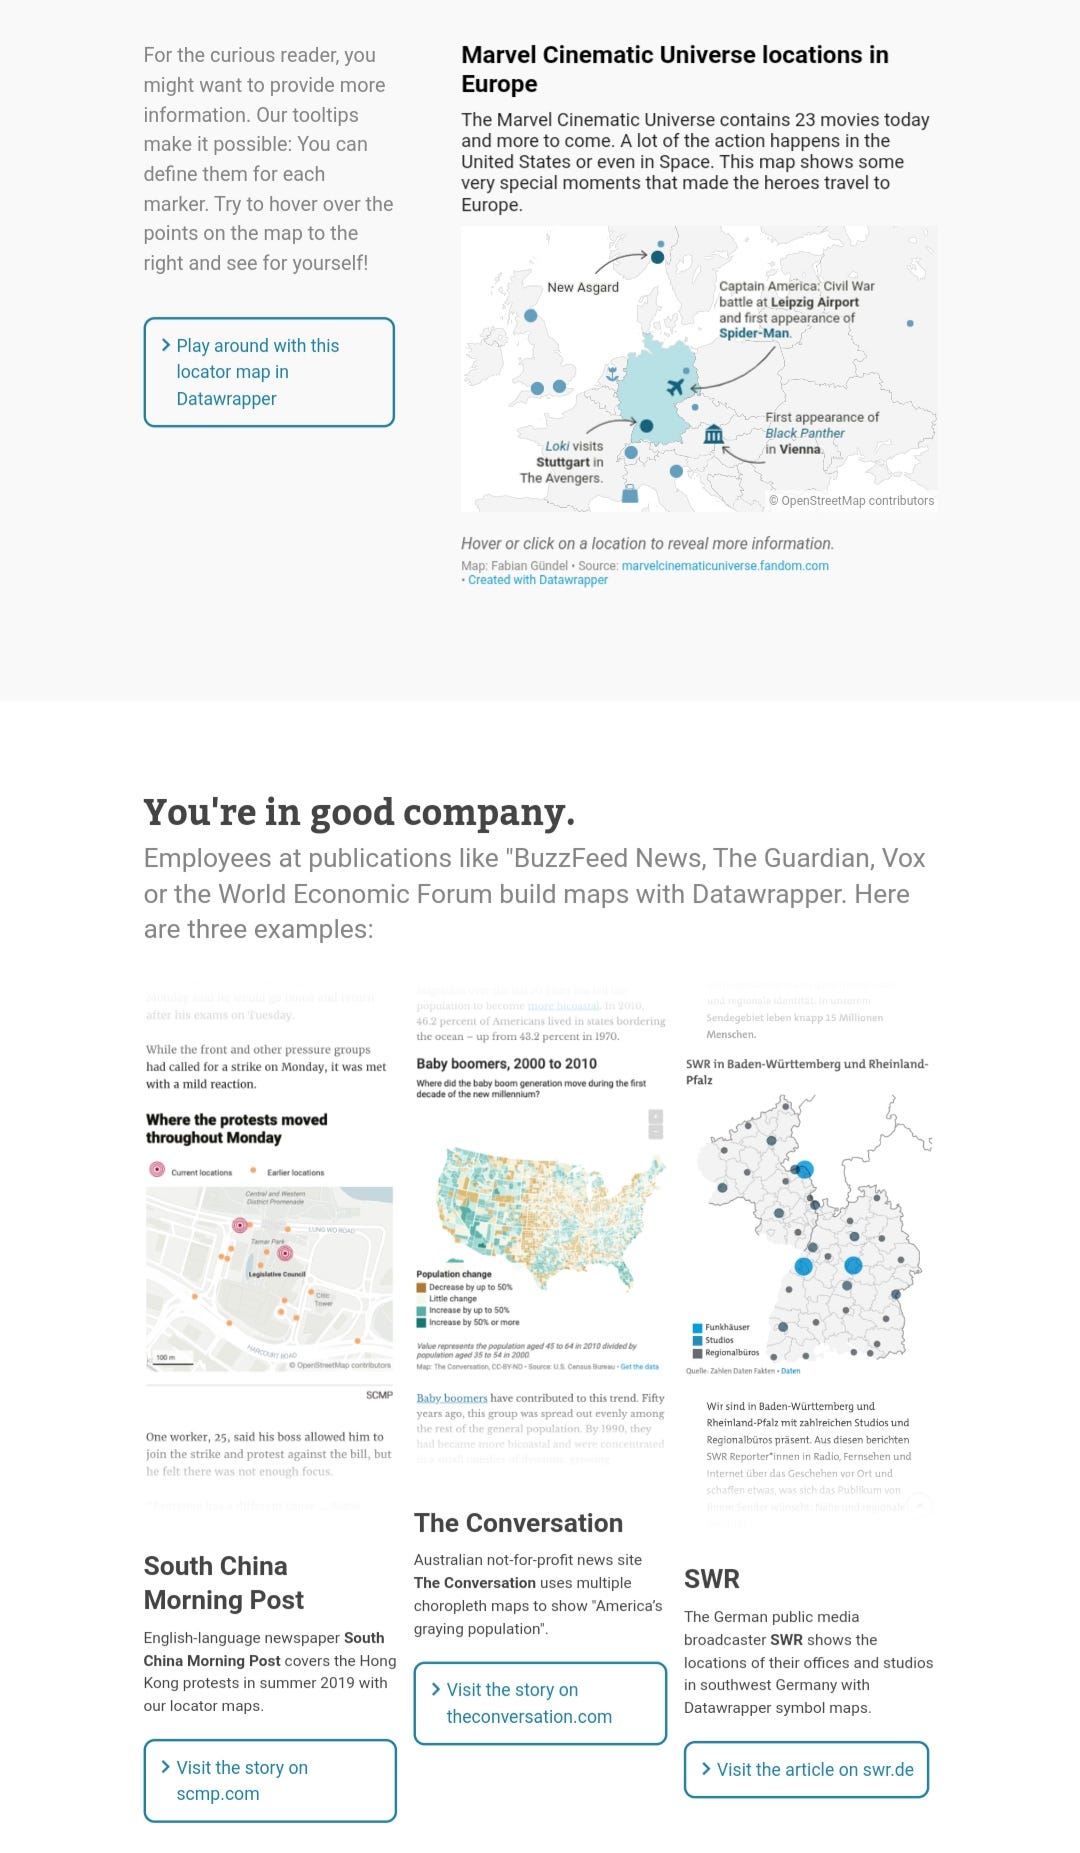
Maps:
Screenshot taken from Datawrapper site.Screenshot taken from Datawrapper site.
Without wasting much time, let's start with it making a chart:
Have a prepared spreadsheet, data table, CSV from your sources like Google spreadsheet, MS Excel, XLS or CSV export or link.
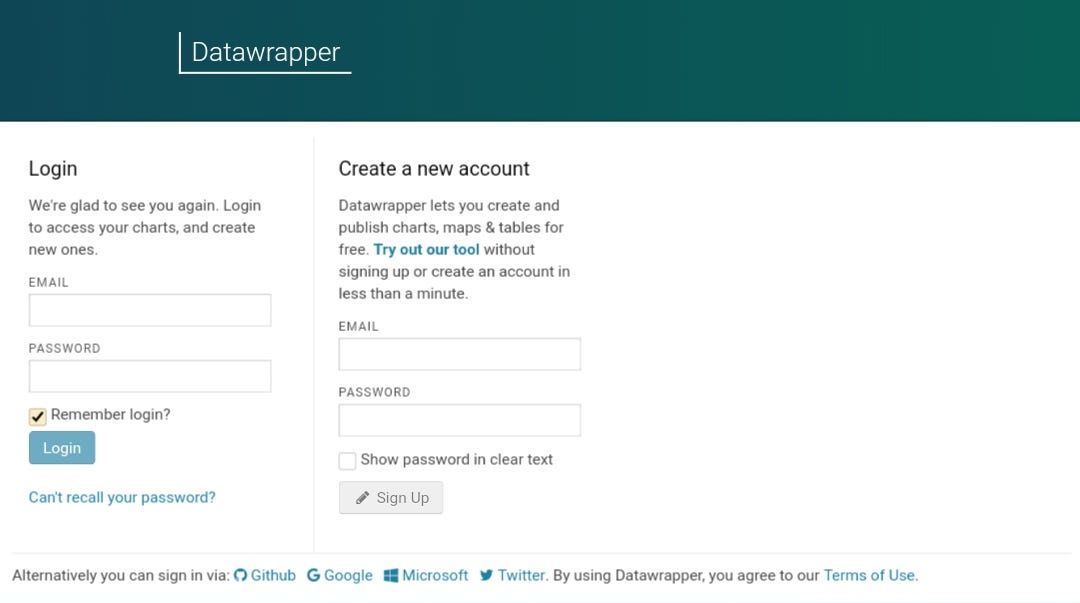
1. Go to Datawrapper, and create an account and confirm your email.
Screenshot taken from Datawrapper site.
Start creating (Embedding chart will require logging in now or then, better login then start.)
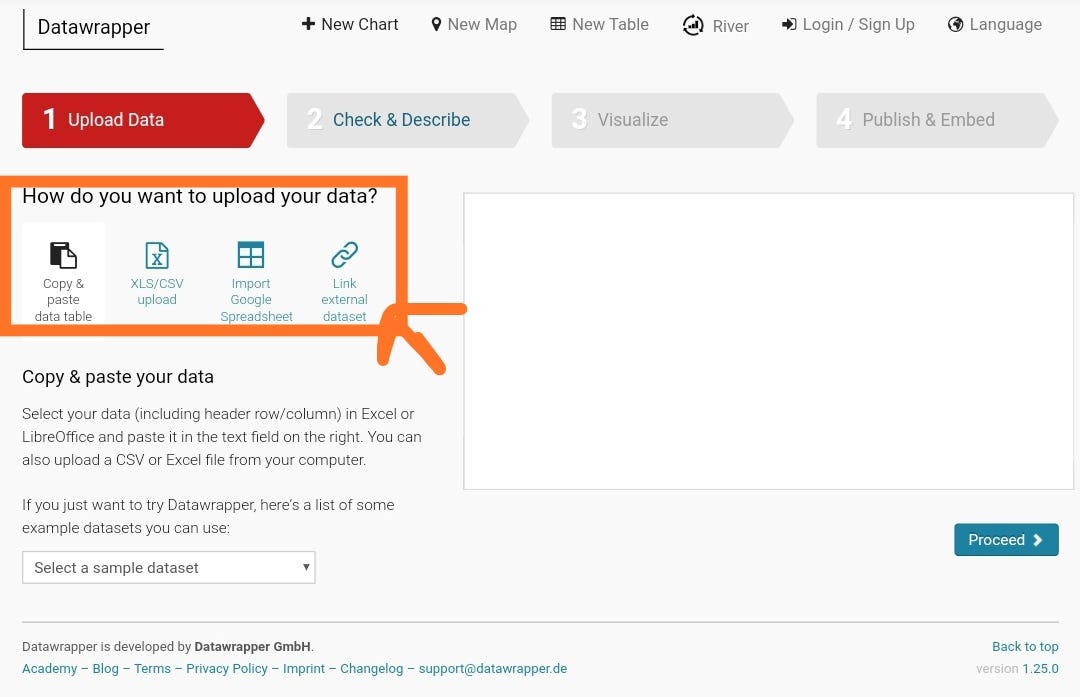
2. Copy-paste or import your Data
Screenshot taken from Datawrapper site.
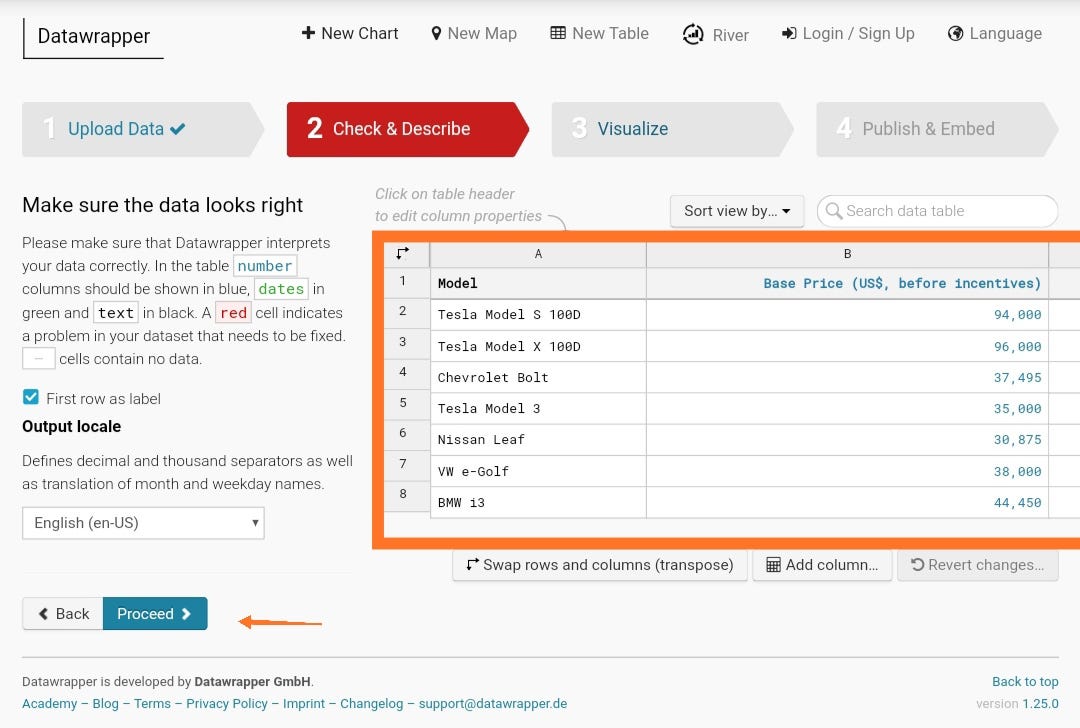
3. Check your Data, make necessary changes by clicking on columns and Proceed
Screenshot taken from Datawrapper site.
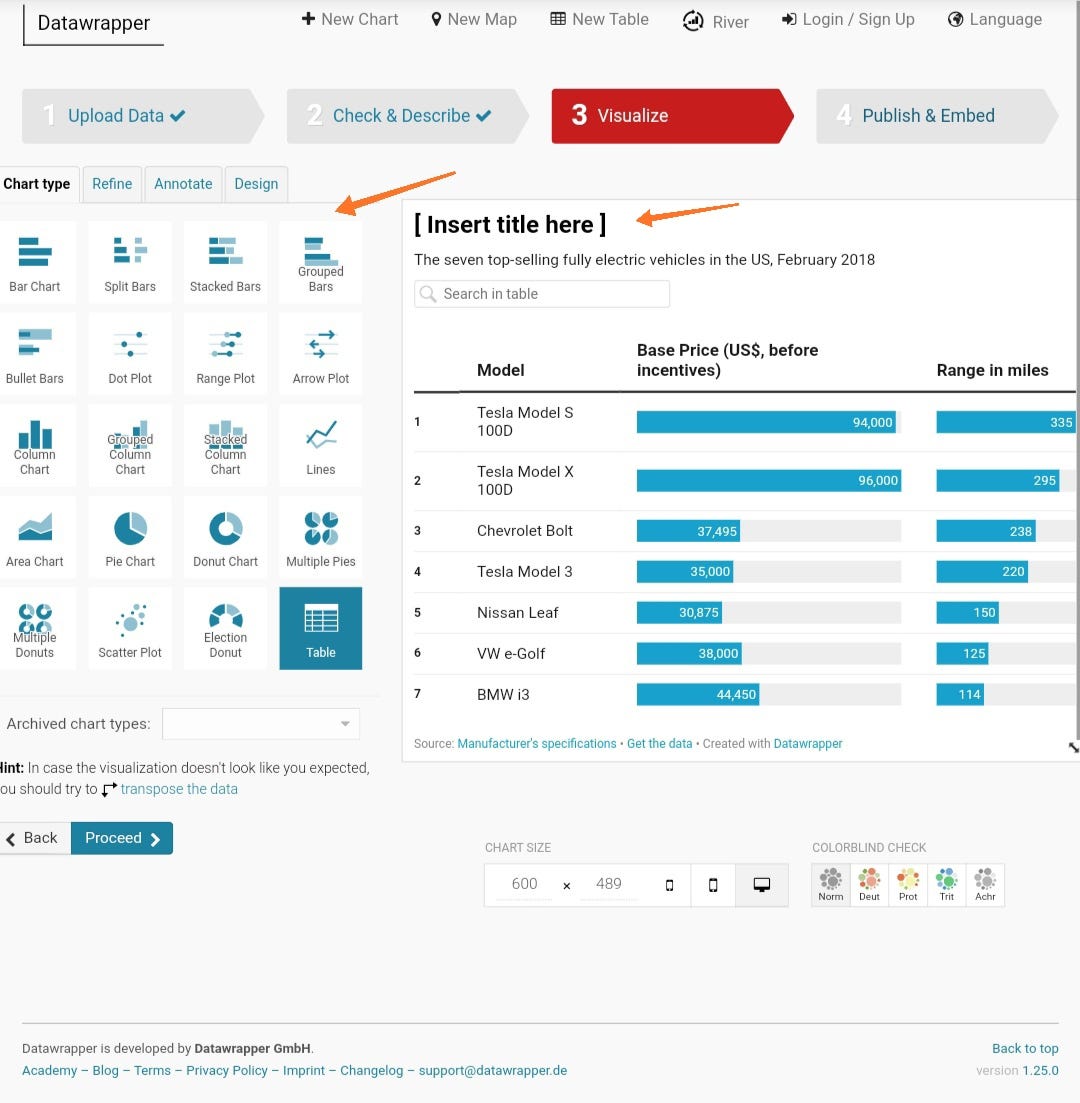
4. Choose your Chart type, then proceed. (Editing your title can be done later as well)
Screenshot taken from Datawrapper site.
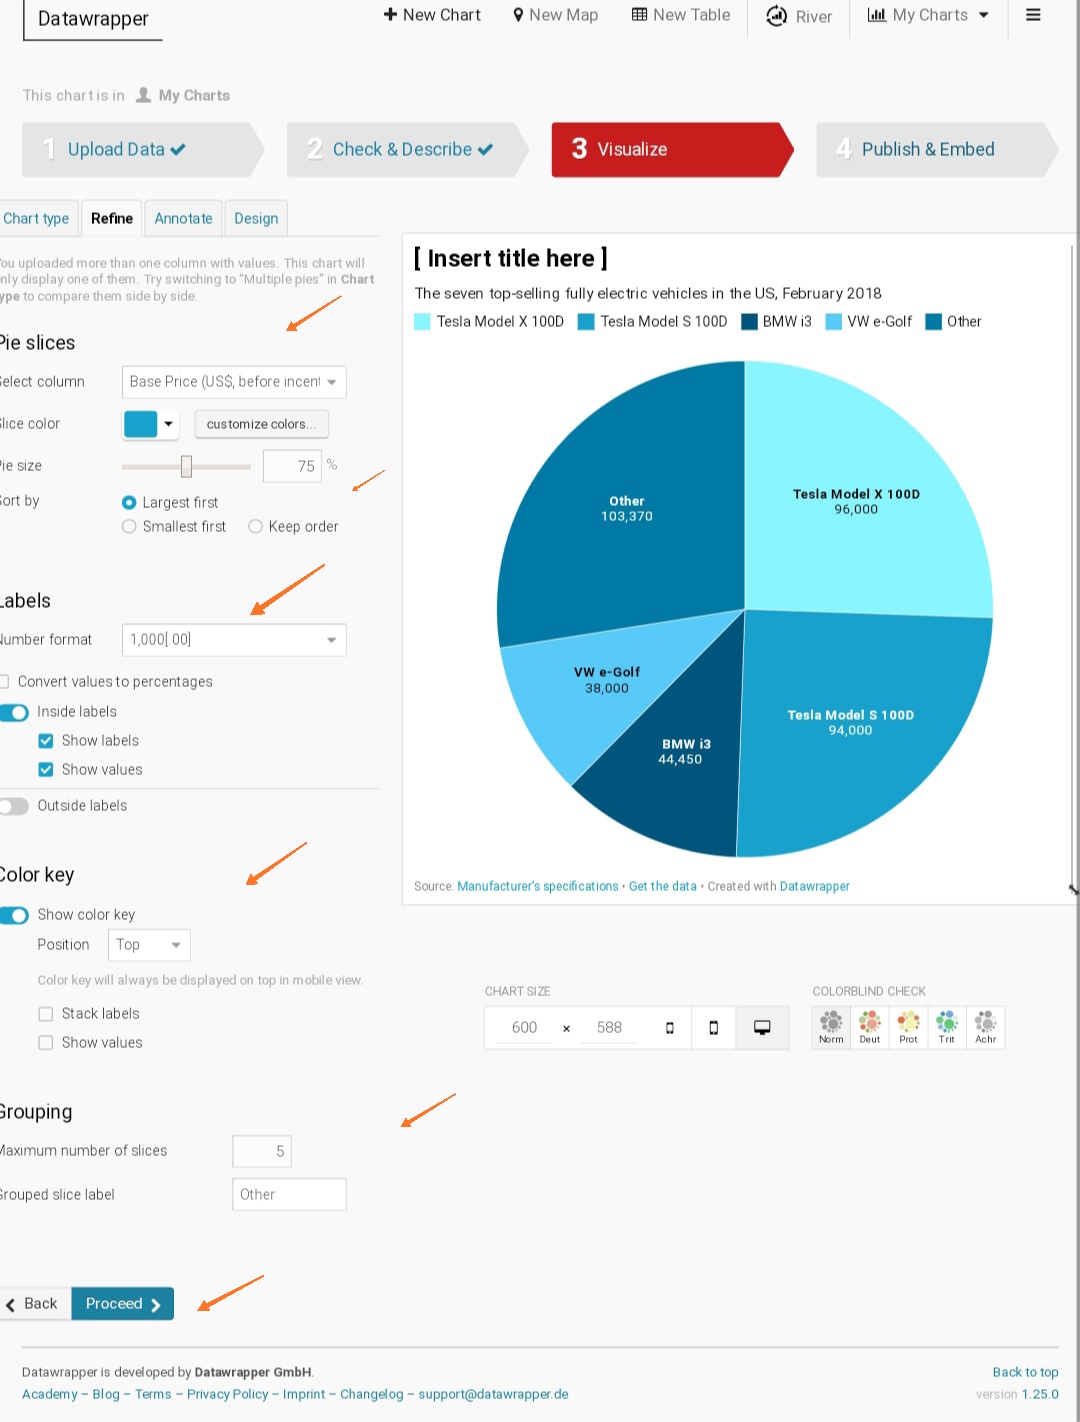
5. Customize colour, label and sort.
Screenshot taken from Datawrapper site.
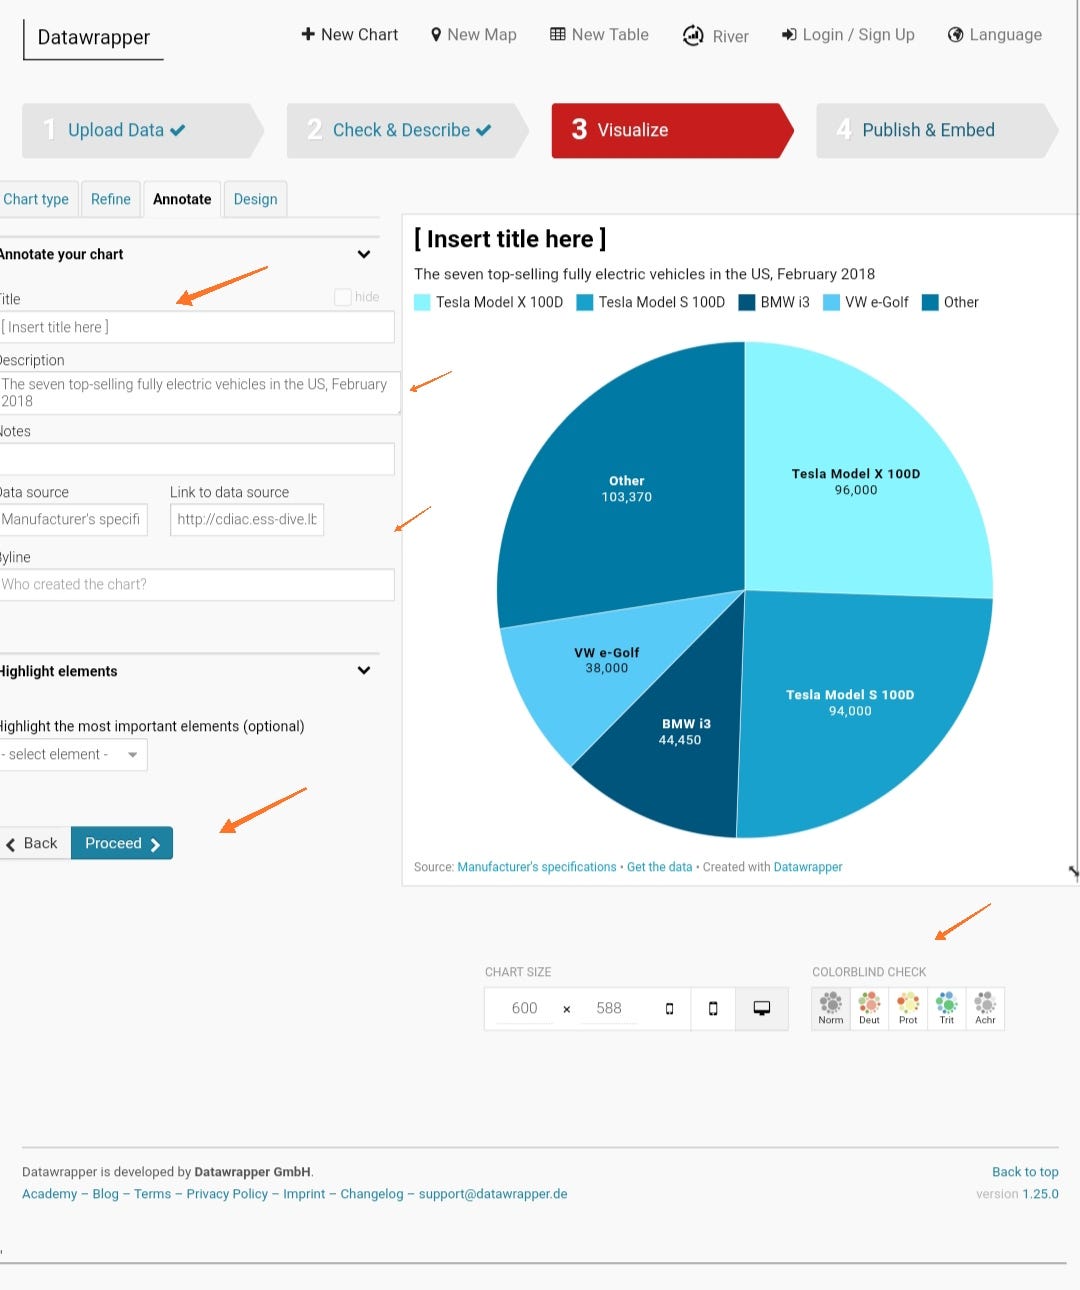
6. Write a title and description for your chart.
Screenshot taken from Datawrapper site.
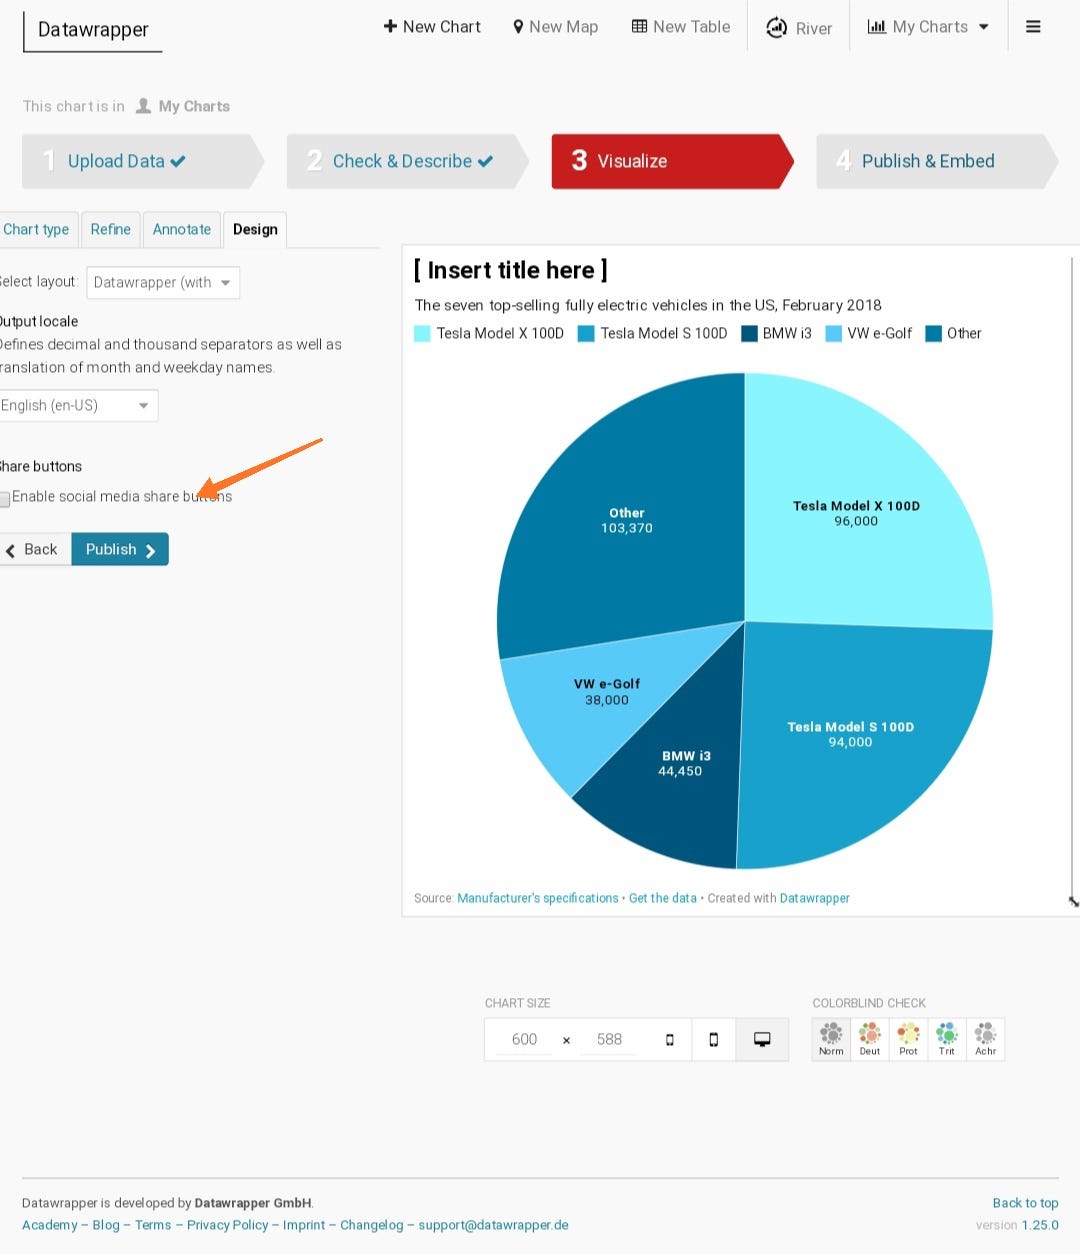
7. Almost there, check to enable share button.
Screenshot taken from Datawrapper site.
8. If you had started without logging in you’ll get this interface, type your email, confirm from your email and add your password. If you had already logged in then go 9.
Screenshot taken from Datawrapper site.
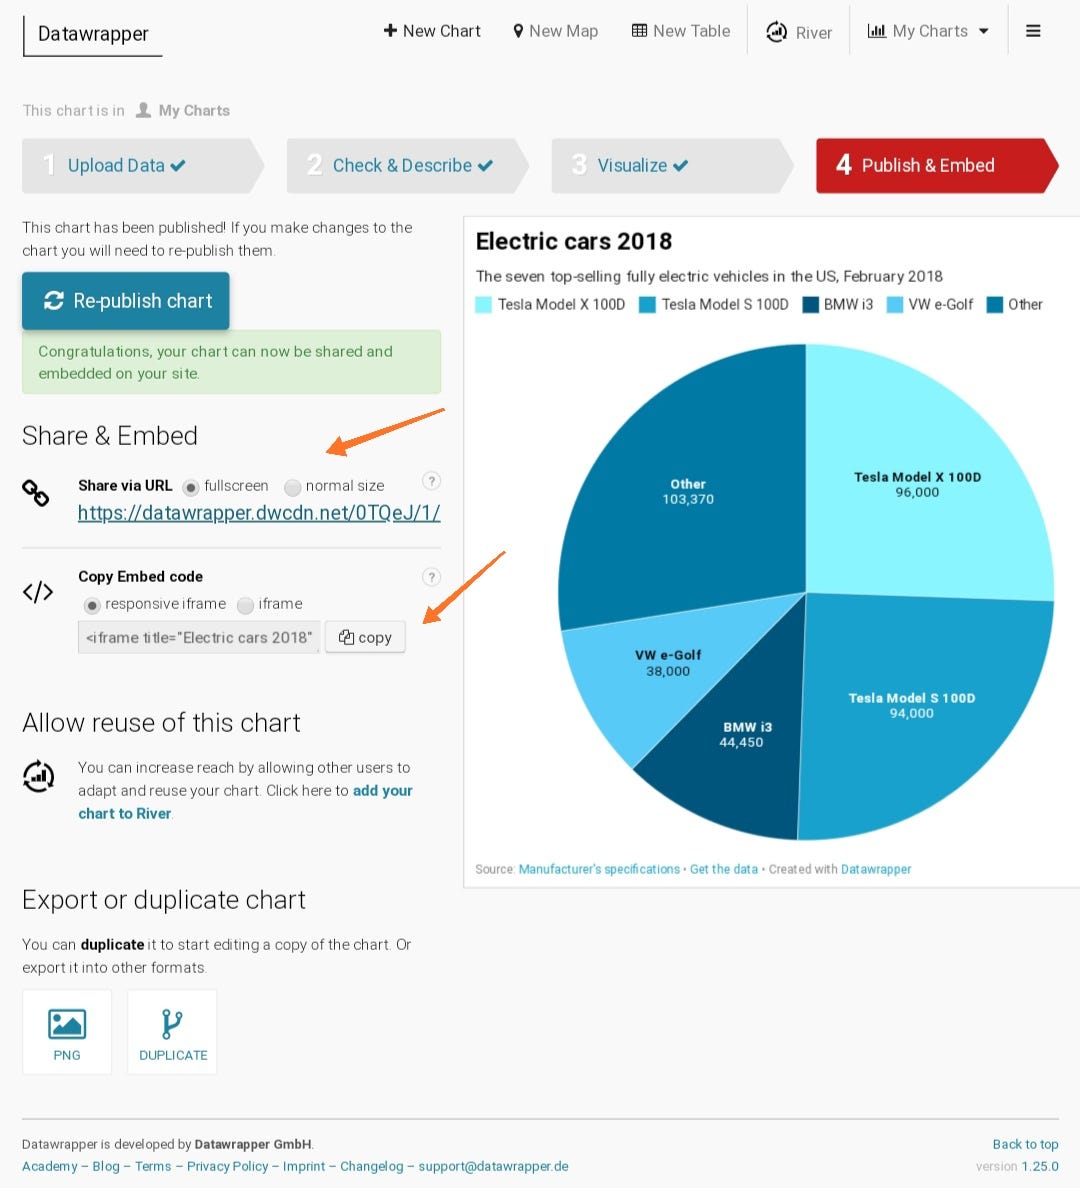
9. Code is ready.
To embed in Medium copy URL.
Screenshot taken from Datawrapper site.
10. To embed in Medium, open your draft, click on arrowhead, paste the copied URL and enter. Done!
Screenshot taken from my Medium draft.
11. To embed in blogger, select HTML editor of draft and paste the code. Done!
Thank you for reading. 😃
How to embed Charts, Maps, Tables in Blog
Reviewed by Nova
on
October 15, 2020
Rating: 5


No comments: